
Three and a half weeks of watching the leaderboard. Here’s what we didn’t expect.
When we launched Shoothill AI Signal, we knew the live data would surprise people. We didn’t expect it to surprise us. After 134 benchmark runs, around 90,600 individual test results and 11 frontier models tracked, a few patterns have emerged that change the answer to “which model should we be using?”
What’s been running
Since AI Signal went live, we’ve been quietly accumulating data. Eleven of the most-used frontier AI models, tested hourly, against the same fixed prompts, scored against the same rubric, every day.
The headline numbers after three and a half weeks:
-
134 benchmark runs
-
~90,600 individual test results
-
11 models from OpenAI, Anthropic, Google and xAI
That’s enough data to start telling the difference between a one-off bad day and a genuine pattern. And the patterns are not the ones we would have predicted in advance.
Here are the three findings that stood out.
1. Google’s cheap tier is punching well above its weight
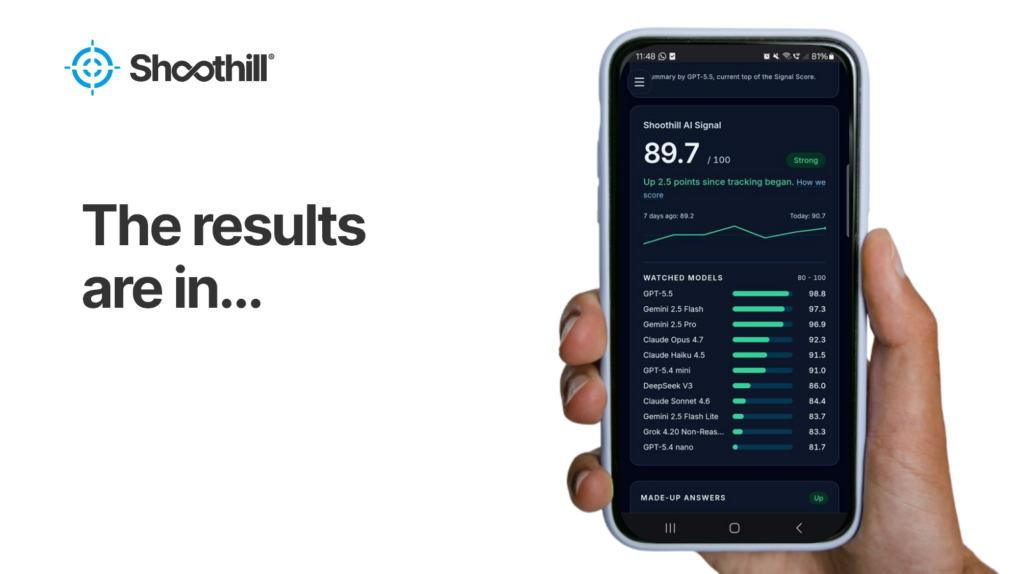
The biggest surprise of the first month is also the simplest. Gemini 2.5 Flash, Google’s mid-tier model, currently outranks Claude Opus 4.7 on overall Signal Score. 95.3 against 92.3.
Opus is Anthropic’s flagship. Flash is positioned as the fast, cheap, everyday option. On paper, this should not be the result.
It gets stranger. Gemini Flash Lite, the budget tier below Flash, is currently beating Claude Sonnet 4.6. The cheapest model in Google’s stable is outscoring a mid-flagship from a competitor.
Two things are worth saying clearly before anyone over-reads this.
First, “overall Signal Score” is one number. It’s a weighted composite of five pillars, and it’s deliberately blunt. A model can lead on composite and still be the wrong tool for a specific task. That’s exactly why we publish the underlying pillars and not just the headline.
Second, scores move. Three and a half weeks is enough to see a pattern, not enough to call a permanent ranking. The whole point of running this hourly is that the picture changes.
But for anyone making a buying decision today, on today’s data, the message is this: don’t assume the most expensive model in your subscription is the best one for the job. It might be. The data says it often isn’t.
2. Four models held a 0% hallucination rate across the full window
A clean sheet on hallucinations over three and a half weeks is genuinely unusual. We expected one or two models to manage it on a good day. Four held it across the full window.
The four:
-
GPT-5.5
-
Gemini 2.5 Flash
-
GPT-5.4 mini
-
Gemini Flash Lite
A note on what this means and what it doesn’t. “Hallucination” here is measured against our test set: a fixed bank of prompts with known-correct answers, where any made-up content, fabricated source or invented fact in the response hard-fails the test. It is not a claim that these models never hallucinate in the wild. They certainly do. What it means is that on the specific tests we run, they have not been caught fabricating across this window.
Two of those four are mid-tier and budget Google models. One is a flagship. One is a small OpenAI model. The list is more interesting for who’s on it than who isn’t, but for the record: not every flagship made it.
For a business choosing a model for any workflow where confidently-wrong output is a real cost, this list is the most actionable single output of the first three weeks of data.
3. Reasoning is the great divider
If you want to know what separates the top of the leaderboard from the middle, the answer is not facts. It’s not instruction-following. It’s not stability. It’s reasoning.
Top-ranked models are posting 90+ on the reasoning pillar. Mid-tier flagships drop to the high 60s.
That’s a 20+ point gap on a 100-point scale, on the pillar designed to test whether a model can work through a multi-step problem without falling over. Bat-and-ball problems, multi-stage calculations, chains of inference that need to hold together to get to the right answer.
The practical implication: for tasks where reasoning is the bottleneck (anything involving numbers, logic, multi-step decisions, comparing options, working through scenarios), the choice of model matters far more than it does for simple retrieval. A 25-point reasoning gap is the difference between a model that gets the answer right and one that doesn’t.
This is also where the cheap-vs-flagship story gets more nuanced. The budget Google models that lead on composite score and clean-sheet hallucination rates do not necessarily lead on reasoning. The split between “good at most things” and “good at hard things” runs straight through the leaderboard.
So what’s the takeaway?
For anyone choosing an AI model right now: “flagship” and “best for your use case” are not the same answer.
That sounds obvious written down. It is not how most procurement decisions are being made. Most teams pick a provider, take whichever model that provider markets as the top tier, and call it done. The data after three and a half weeks suggests that approach is leaving real performance on the table, and in some cases paying a premium for it.
Three quick questions worth asking before your next AI model decision:
-
What is the actual job? Reasoning-heavy? Retrieval-heavy? High-stakes accuracy? Conversational? The right pillar to optimise for changes everything.
-
What’s the cost of being confidently wrong? If the answer is “high,” the hallucination-rate column matters more than the composite.
-
When did you last check? Models change. The right answer six months ago may not be the right answer today.
The leaderboard moves. That’s the point of running it live.
Live leaderboard: signal.shoothill.ai
If there’s a model you’d like added to the watchlist, you can request it from the dashboard.