What makes a great dashboard? Lessons from Shoothill’s design team
In a world awash with data, dashboards have become the modern control rooms of decision-making. But not all dashboards are created equal. At Shoothill, we’ve spent years designing intelligent, intuitive dashboards that do more than just display numbers. They tell stories, reveal patterns, and drive action.
So, what separates a great dashboard from a forgettable one? Here are some key lessons we’ve learned along the way.
Clarity over clutter
The best dashboards are clean, focused, and purposeful. It’s tempting to cram in every available metric, but more data doesn’t always mean more insight. At Shoothill, we prioritise clarity, highlighting what matters most and stripping away the noise.
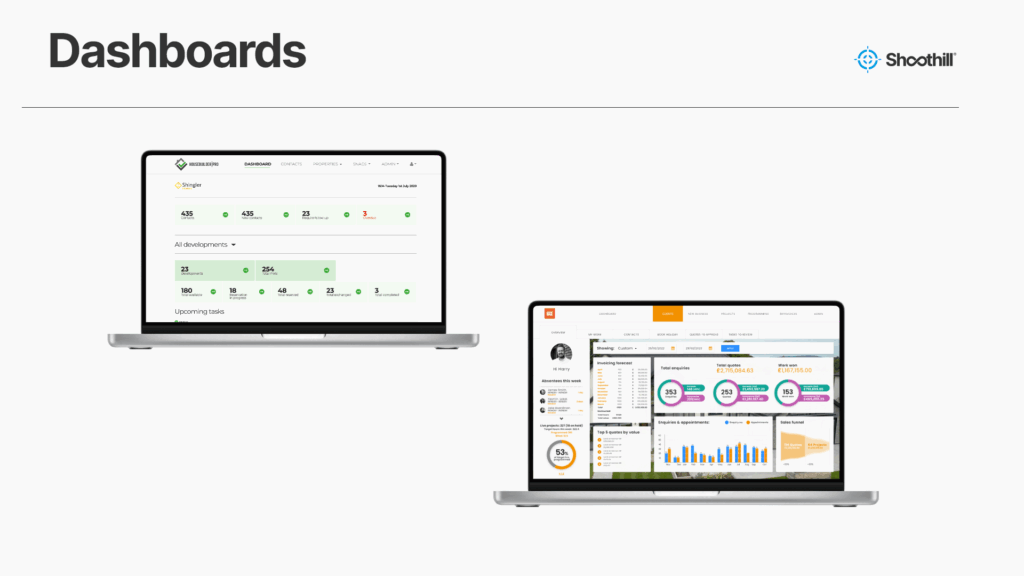
Take our Housebuilder Pro dashboard, for example. It provides a clear, real-time view of development sales progress, outstanding tasks, new contacts, and prospective leads—all in one place. The interface is designed to be intuitive and accessible, ensuring that users can quickly grasp key insights without needing technical expertise. That’s no accident, it’s the result of thoughtful design choices that prioritise simplicity, efficiency, and actionable information for busy housebuilders and sales teams.
Real-time data, real-world relevance
A dashboard is only as good as the data behind it. Shoothill’s platforms are built to handle live data streams, whether it’s flood alerts, energy consumption, or user-generated content. But we don’t just show data, we contextualise it.
In FloodAlerts, users can track real-time flood warnings alongside historical water level data, clearly showing when levels are above or below normal. This dual perspective helps users identify unusual patterns, assess risk more accurately, and make timely, informed decisions. By combining live alerts with contextual trends, FloodAlerts offers a powerful tool for proactive flood management and planning.
Design for the user, not the developer
Too often, dashboards are built from the inside out, designed by developers for developers. At Shoothill, we flip that approach. We start with the user: What do they need to know? What actions do they need to take? What devices are they using?
Visuals that speak volumes
Data visualisation is at the heart of what we do. But good visuals aren’t just pretty—they’re purposeful. We use maps, graphs, heatmaps, and timelines to surface insights that might otherwise go unnoticed.
Flexibility and scalability
A great dashboard grows with its users. Shoothill’s platforms are built to scale, whether that means adding new data sources, integrating with third-party systems, or adapting to new use cases.
We also believe in modular design. Our dashboards can be customised for different departments, roles, or regions, ensuring that each user sees the data that’s most relevant to them.
Dashboards that do more
At Shoothill, we don’t just build dashboards, we build decision engines. Our goal is to turn complex data into clear, actionable insight. That means thoughtful design, robust engineering, and a relentless focus on the user.
In a data-driven world, a great dashboard isn’t just a nice-to-have; it’s a competitive advantage. And we’re proud to be helping organisations across the UK harness that power every day.
☎️ 01743 636300 📧[email protected]
🌐 To get a taste of our work visit us at www.shoothill.com